
Page 56 - The Vasculitides Volumes 2
P. 56
32 Adam J. Davis and David S. Younger
Figure 10 (a, b). Nuclear medicine perfusion with SPECT. Intravenous administration of Tc-99m Ceretec.
Left to right (a) and top to bottom (b) transaxial, sagittal and coronal images show normal distribution of the
radiotracer. Abbreviations: SPECT, single photon emission computed tomography; Tc, Technetium. Courtesy
of Serafin Tiu, M.D.
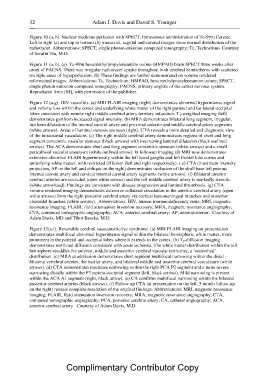
Figure 11 (a, b). (a). Tc-99m hexamethylpropyleneamine oxime (HMPAO) brain SPECT three weeks after
onset of PACNS. There was irregular radiotracer uptake throughout both cerebral hemispheres with scattered
multiple areas of hypoperfuision. (b) These findings are further demonstrated on volume rendered
reformatted images. Abbreviations: Tc, Technetium; HMPAO, hexamethylpropyleneamine oxime; SPECT,
single photon emission computed tomography; PACNS, primary angiitis of the center nervous system.
Reproduced from [84], with permission of the publisher.
Figure 12 (a-g). HIV vasculitis. (a) MRI FLAIR imaging (right) demonstrates abnormal hyperintense signal
and volume loss within the cortex and underlying white matter of the right parietal and far lateral occipital
lobes consistent with remote right middle cerebral artery territory infarction. T1-weighted imaging (left)
demonstrates gyrifrom increased signal intensity. (b) MRA demonstrates bilateral long segment, irregular,
fusiform dilatation of the internal carotid artery and proximal anterior and middle cerebral artery segments
(white arrows). Areas of luminal stenosis are seen (right). CTA reveals a more detailed and diagnostic view
of the intracranial vasculature. (c) The right middle cerebral artery demonstrates regions of short and long
segment concentric vascular stenoses (black arrows) with intervening luminal dilatation (black outlined
arrows). The ACA demonstrates short and long segment concentric stenoses (white arrows) and a small
pericallosal saccular aneurysm (white outlined arrow). In followup imaging (d) MRI now demonstrates
extensive abnormal FLAIR hyperintensity within the left basal ganglia and left frontal lobe cortex and
underlying white matter, with restricted diffusion (left and right respectively). ( e) CTA (maximum intensity
projection, AP on the left and oblique on the right) demonstrates occlusion of the skull base left petrous
internal carotid artery and cervical internal carotid artery segments (white arrows). (f) Bilateral anterior
cerebral arteries are occluded (open white arrows) and the left middle cerebral artery is markedly stenotic
(white arrowhead). Findings are consistent with disease progression and luminal thrombosis. (g) CTA
volume rendered imaging demonstrates extensive collateral circulation to the anterior cerebral artery (open
white arrows) from the right posterior cerebral artery via cortical leptomeningeal branches and posterior
choroidal branches (white arrows). Abbreviations: HIV, human immunodeficiency virus; MRI, magnetic
resonance imaging; FLAIR, fluid attenuation inversion recovery; MRA, magnetic resonance angiography;
CTA, computed tomographic angiography; ACA, anterior cerebral artery; AP, anteroposterior. Courtesy of
Adam Davis, MD and Tibor Bescke, M.D.
Figure 13(a-f). Reversible cerebral vasoconstrictive syndrome. (a) MRI FLAIR imaging on presentation
demonstrates multifocal abnormal hyperintense signal within the bilateral hemispheric white matter, more
prominent in the parietal and occipital lobes where it extends to the cortex. (b) T2-diffusion imaging
demonstrates restricted diffusion consistent with acute ischemia. The white matter distribution within the left
hemisphere straddles the anterior, middle and posterior cerebral vascular territories, a „watershed?
distribution. (c) MRA at admission demonstrates short segment multifocal narrowing within the distal
bilateral vertebral arteries, the basilar artery, and bilateral middle and posterior cerebral vasculature (white
arrows). (d) CTA demonstrates moderate narrowing within the right PCA P2 segment and a more severe
narrowing distally within the P3 parieto-occipital segment (left, black arrows). Mild narrowing is present
within the ACA A1 segment (right, black arrow). (e) CA confirms multifocal narrowing within the bilateral
posterior cerebral arteries (black arrows). (f) Follow up CTA (at presentation on the left, 5 month follow-up
on the right) reveals complete resolution of the original findings. Abbreviations: MRI, magnetic resonance
imaging; FLAIR, fluid attenuation inversion recovery; MRA, magnetic resonance angiography; CTA,
computed tomographic angiography; PCA, posterior cerebral artery; CA, catheter angiography; ACA,
anterior cerebral artery. Courtesy of Adam Davis, M.D.
Complimentary Contributor Copy