
Page 55 - The Vasculitides Volumes 2
P. 55
Neuroimaging of the Vasculitides 31
radiographic findings of these diseases even in the same individual. Abbreviations: MRA, magnetic
resonance angiography; MRI, magnetic resonance imaging; FLAIR, fluid attenuation inversion recovery;
ADC, apparent diffusion coefficient; CTA, computed tomographic angiography. Courtesy of Adam Davis,
M.D.
Figure 6 (a-d). Systemic lupus erythematosus. (a) MRI FLAIR sequence at presentation (left) reveals bilateral
hemispheric white matter signal abnormality with involvement of the parietal and occipital grey matter. Right
medial parietal cortical hyperintensity on diffusion weighted imaging (Figure 6a, middle, black arrow) with
ADC low signal intensity (not shown) is consistent with acute ischemia in the right posterior cerebral artery
parieto-occipital division. Gradient echo imaging (right, black outlined arrow) demonstrates focal
susceptibility effect, indicating hemosiderin deposition from microhemorrhage. (b) Diffusion MRI of the
brain at a later date reveals restricted diffusion characterized by increased T2 diffusion and decreased ADC
signal intensity within a large confluent region of the medial right parietal lobe and occipital lobes, extending
to the splenium of the corpus callosum, consistent with extension of acute infarction in the right posterior
cerebral artery territory. (c) MRA demonstrates multifocal luminal narrowing, mostly short segment and
occasionally severe, as well as long segment stenoses within the bilateral middle cerebral artery M1 segments
(black arrows). Similar changes are present within the distal internal carotid artery (not marked). The right
posterior cerebral artery demonstrates multifocal luminal narrowing and abrupt occlusion of the parieto-
occipital branch (black outlined arrows). The extensive large and medium vessel multi-segmental, tandem,
luminal irregularity and narrowing is more indicative of a vasculitic process than a thromboembolic process.
(d) CA confirms the long segment irregular luminal narrowing with interspersed segments of normal luminal
caliber and contour within all vascular territories. Abbreviations: MRI, magnetic resonance imaging; FLAIR,
fluid attenuation inversion recovery; ADC, apparent diffusion coefficient; MRA, magnetic resonance
angiography; CA, catheter angiography. Courtesy of Adam Davis, M.D.
Figure 7 (a-c). Behçet disease. (a) Axial and sagittal FLAIR imaging (left and right respectively)
demonstrates strikingly geographic abnormal hyperintense signal intensity in the midbrain and pontine
tegmentum with little mass effect. (b) Areas of diffusion restriction characterized byT2 diffusion hyperintense
and ADC hypointense signal (left and right respectively, white arrows) in the left paramedical caudal
midbrain reflective of acute or early subacute infarction. (c) Axial and coronal post gadolinium T1-weighted
images (left and right respectively) demonstrate peripheral curvilinear and punctate nodular enhancement.
Abbreviations: FLAIR, fluid attenuation inversion recovery; ADC, apparent diffusion coefficient. Courtesy
of Adam Davis, M.D.
Figure 8 (a-e). Primary angiitis of the central nervous system. (a) Non-contrast CT (top) demonstrates
multifocal regions of low attenuation. Those in the right frontal subcortical white matter and left basal
ganglia (black arrows) are sharply defined, without mass effect and likely reflect old infarctions. Both the
cortex and underlying white matter of the right occipital lobe are involved as is the right splenium of the
corpus callosum (white arrows). In these locations the margins are more ill-defined and there is subtle mass
effect characterized by sulcal and ventricular effacement, suggesting acute ischemia in the right posterior
cerebral artery territory. MRI FLAIR imaging (middle) demonstrates central low and peripheral high signal
intensity within the frontal and periventricular white matter lesions (black arrows) consistent with chronic
encephalomalacia from old infarctions. The FLAIR hyperintense signal within the right occipital lobe is more
confluent and extends to the posterior temporal lobe and splenium, involving both cortex and white matter
(white arrows) and better delineates the extent of the acute infarct. DWI (bottom) demonstrates restricted
diffusion consistent with acute ischemia. (b) T1-weighted imaging pre and post-gadolinium demonstrates
extensive leptomeningeal enhancement along the cortical surface of the posterior temporal and occipital
lobes. (c) CTA demonstrates multifocal vascular narrowing within several branches of the MCA (white
arrows) with intervening regions of normal appearing vasculature. At the bottom of the image vascular
narrowing within the posterior cerebral artery (not marked) is present. (d and e) CA reveals completely
normal extra-cranial vasculature. The anterior cerebral (black arrowheads), middle cerebral (black arrows)
and posterior cerebral artery (black outlined arrows) demonstrate mild to severe short segment stenoses.
Abbreviations: CT, computed tomography; MRI, magnetic resonance imaging; FLAIR, fluid attenuation
inversion recovery; CTA, computed tomographic angiography; DWI, diffusion-weighted imaging; MCA,
middle cerebral artery. Courtesy of Adam Davis, M.D. and Tibor Bescke, M.D.
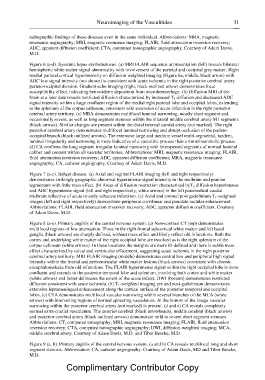
Figure 9 (a, b). Primary angiitis of the central nervous system. (a and b) CA reveals multifocal long and short
segment stenosis. Abbreviation: CA, catheter angiography. Courtesy of Adam Davis, MD and Tibor Bescke,
M.D.
Complimentary Contributor Copy